
Home - Live Map
Home Page
As you log into the Jia Web application, you will be taken to the Home page.
Home is where you can access the Live Map in order to visualize all of the tasks and fixed assets in your district, as well as track your employees.
Tasks
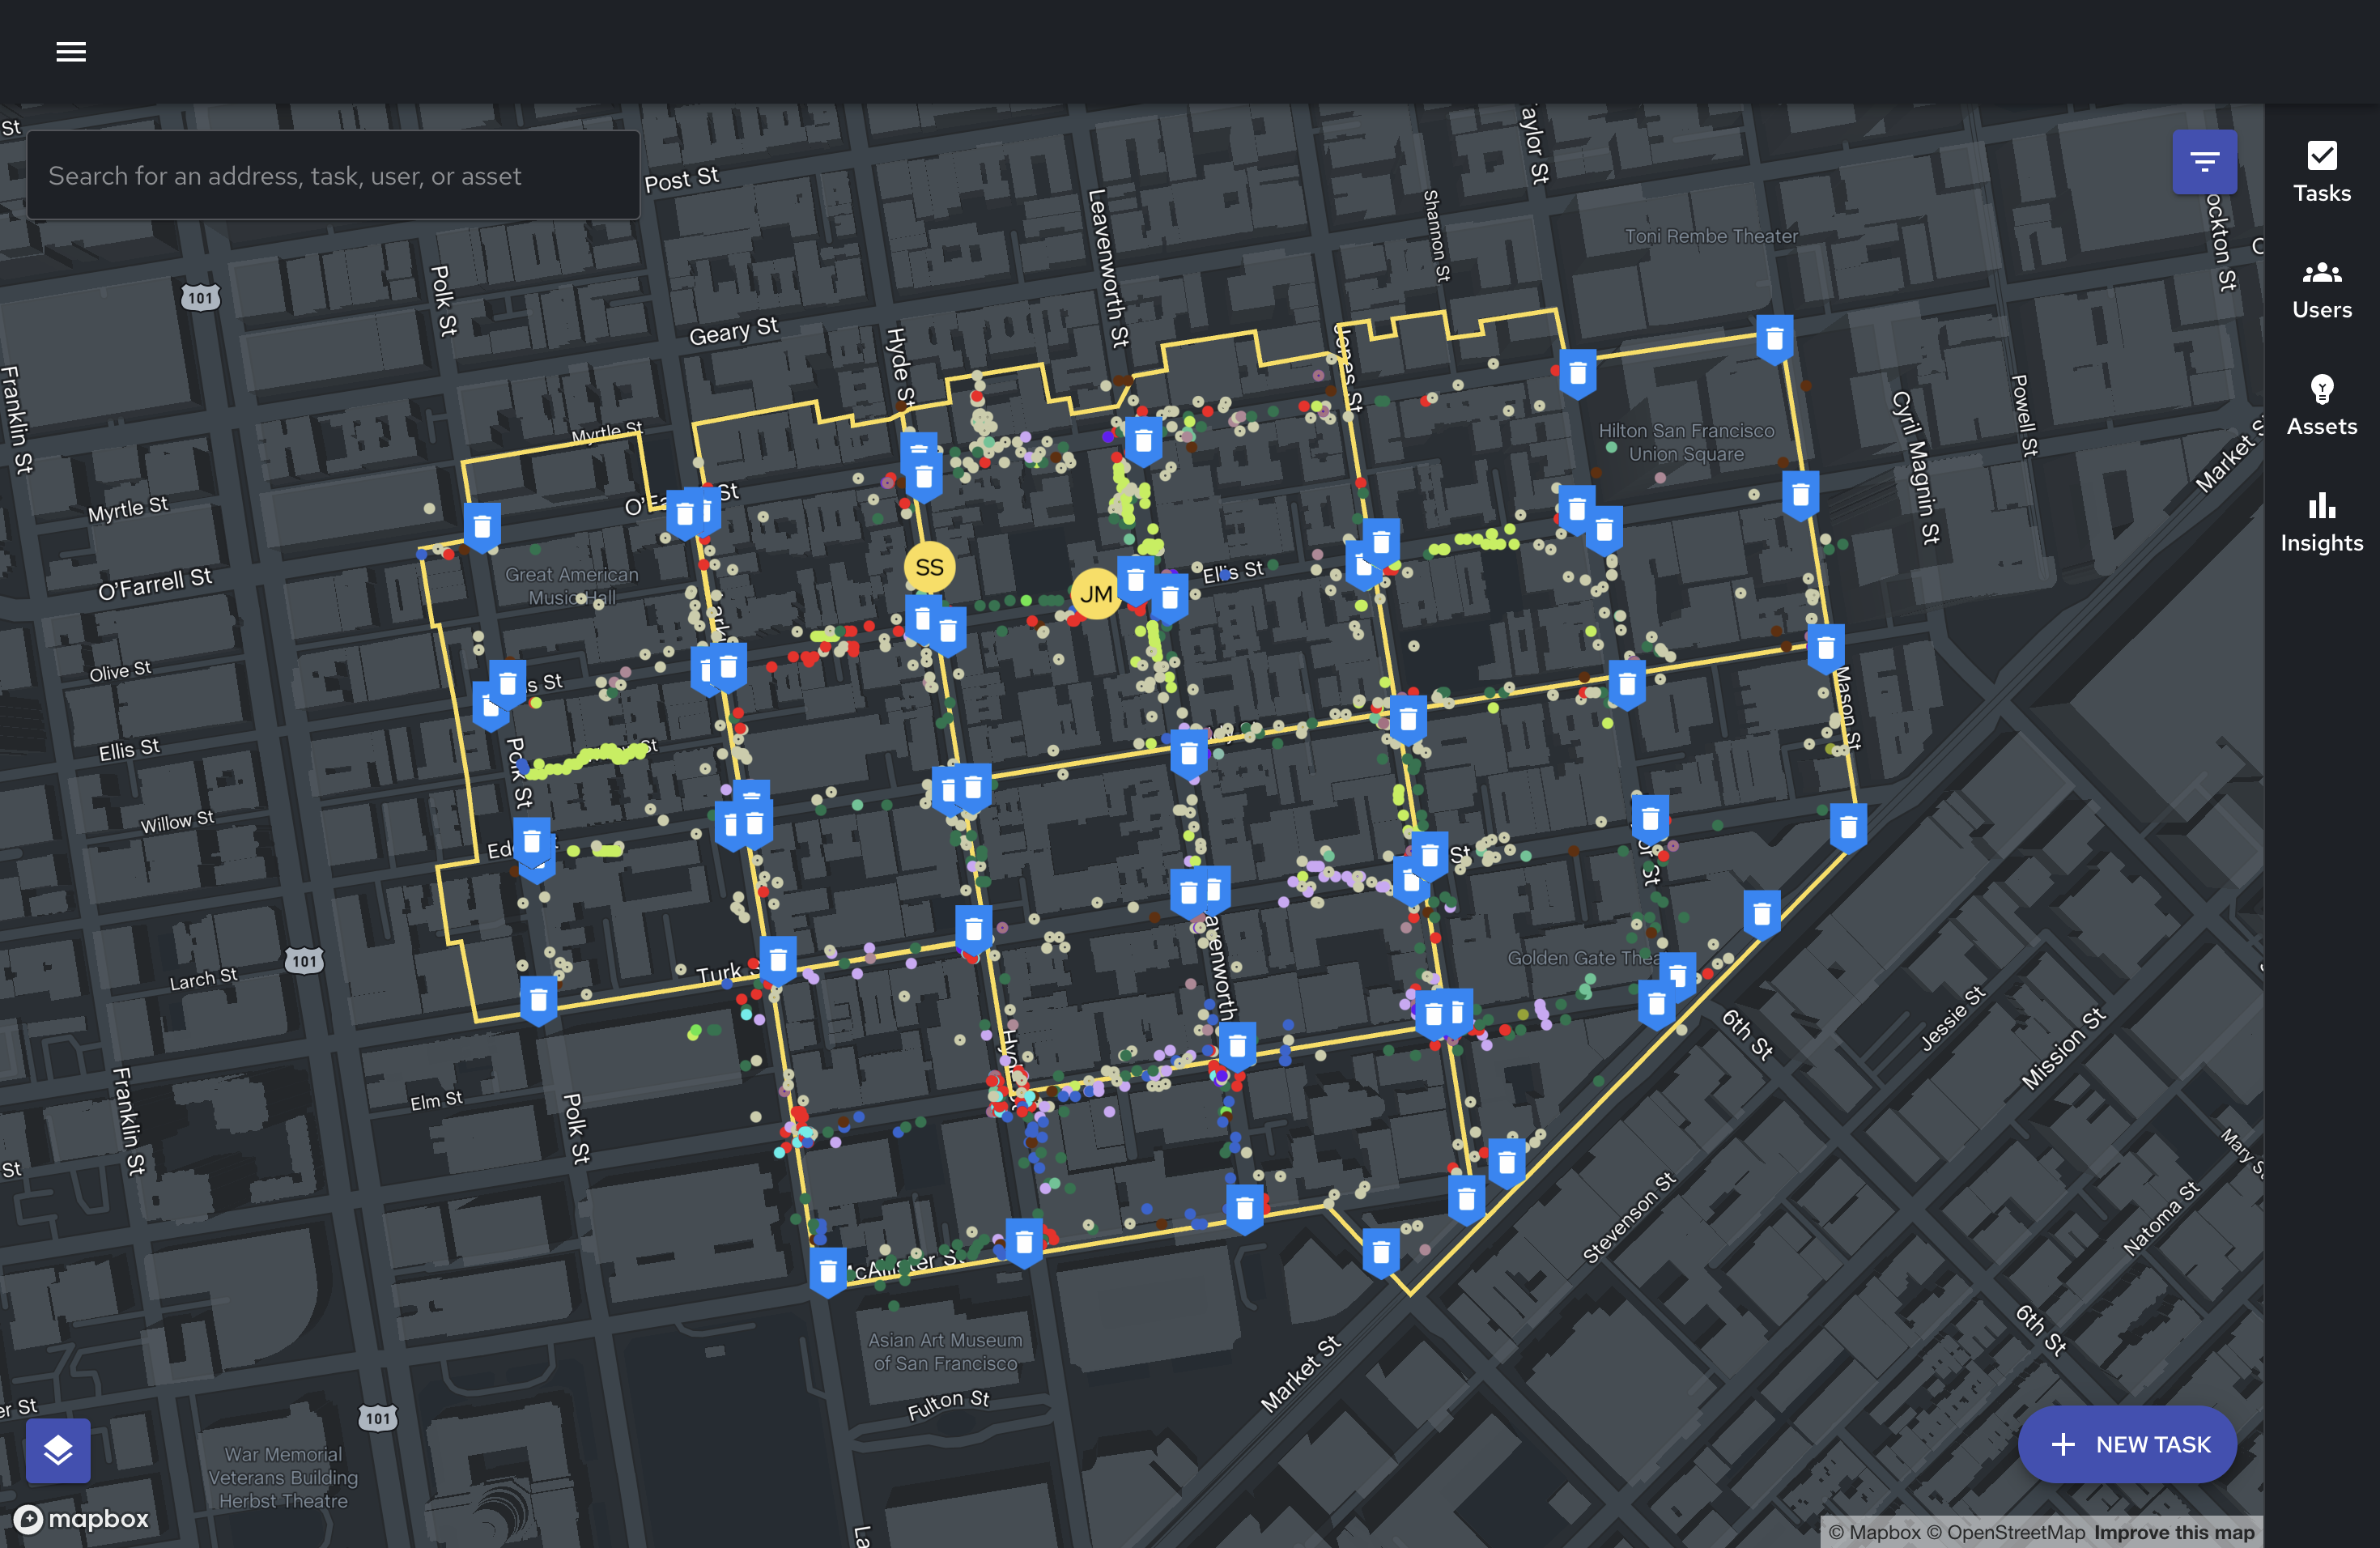
Tasks (or service requests) are represented by color-coded dots on the live map. Each color corresponds with a task category that you will setup during the onboarding process.
Task Popup
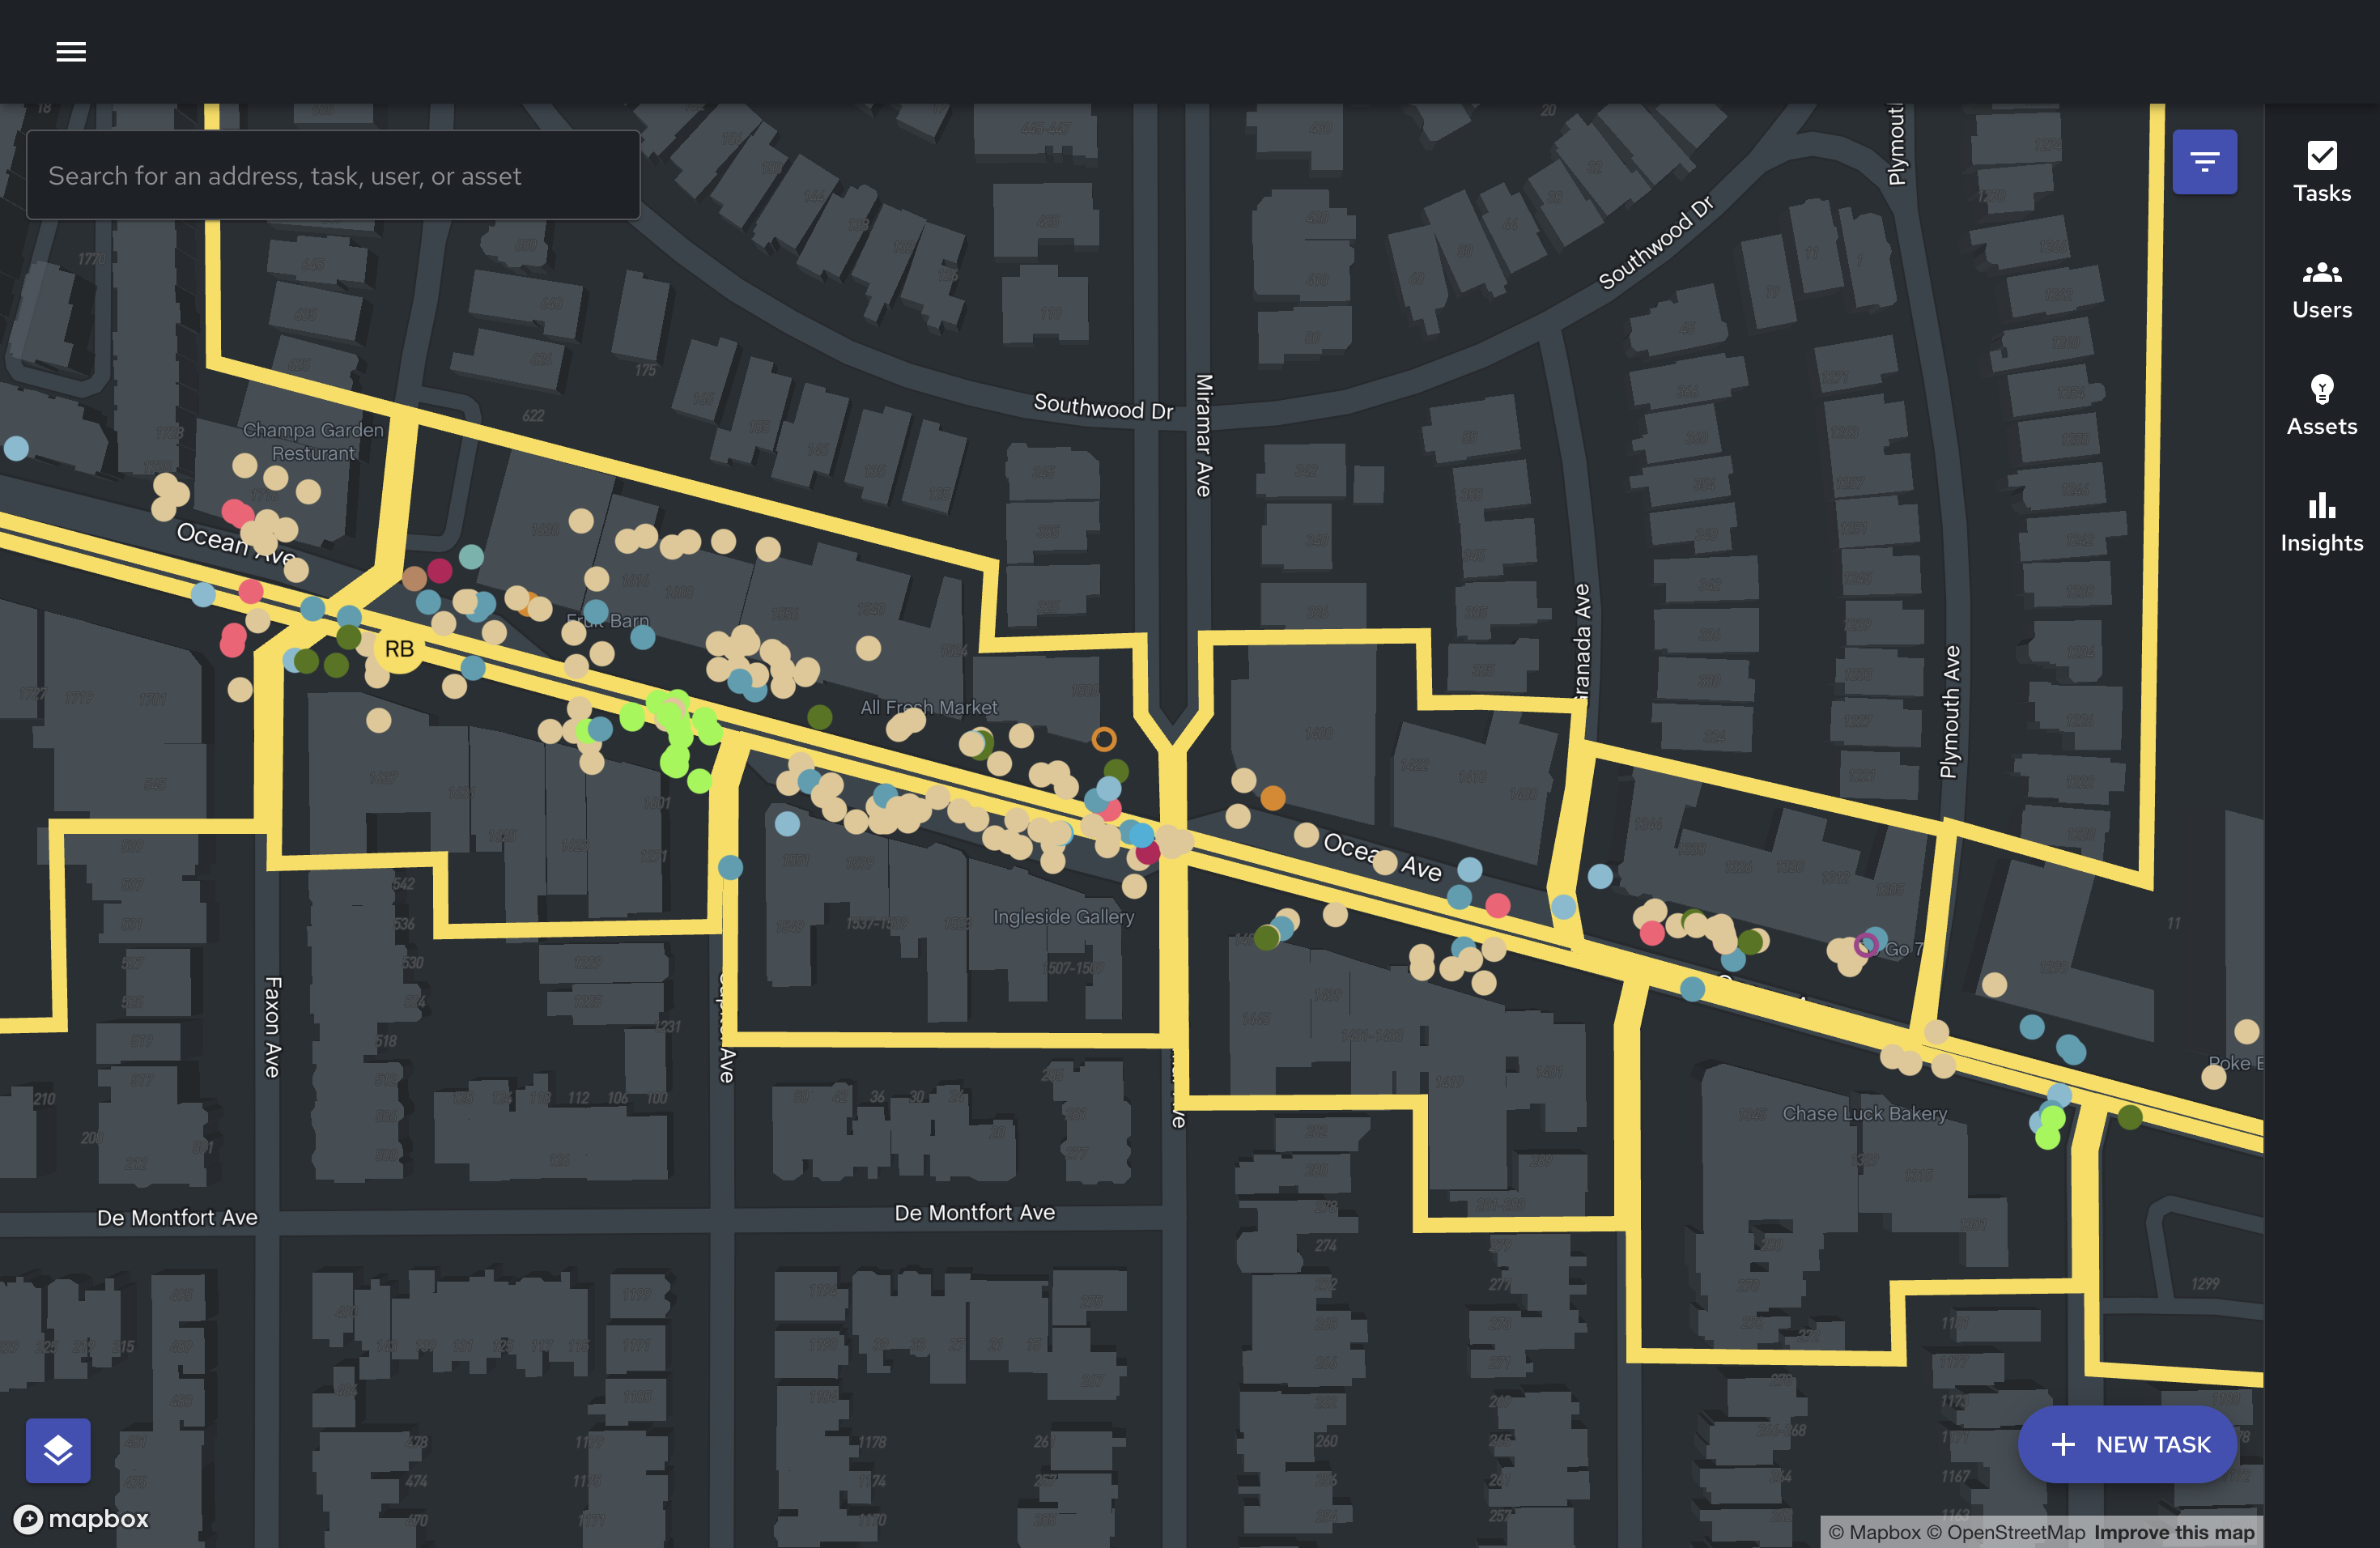
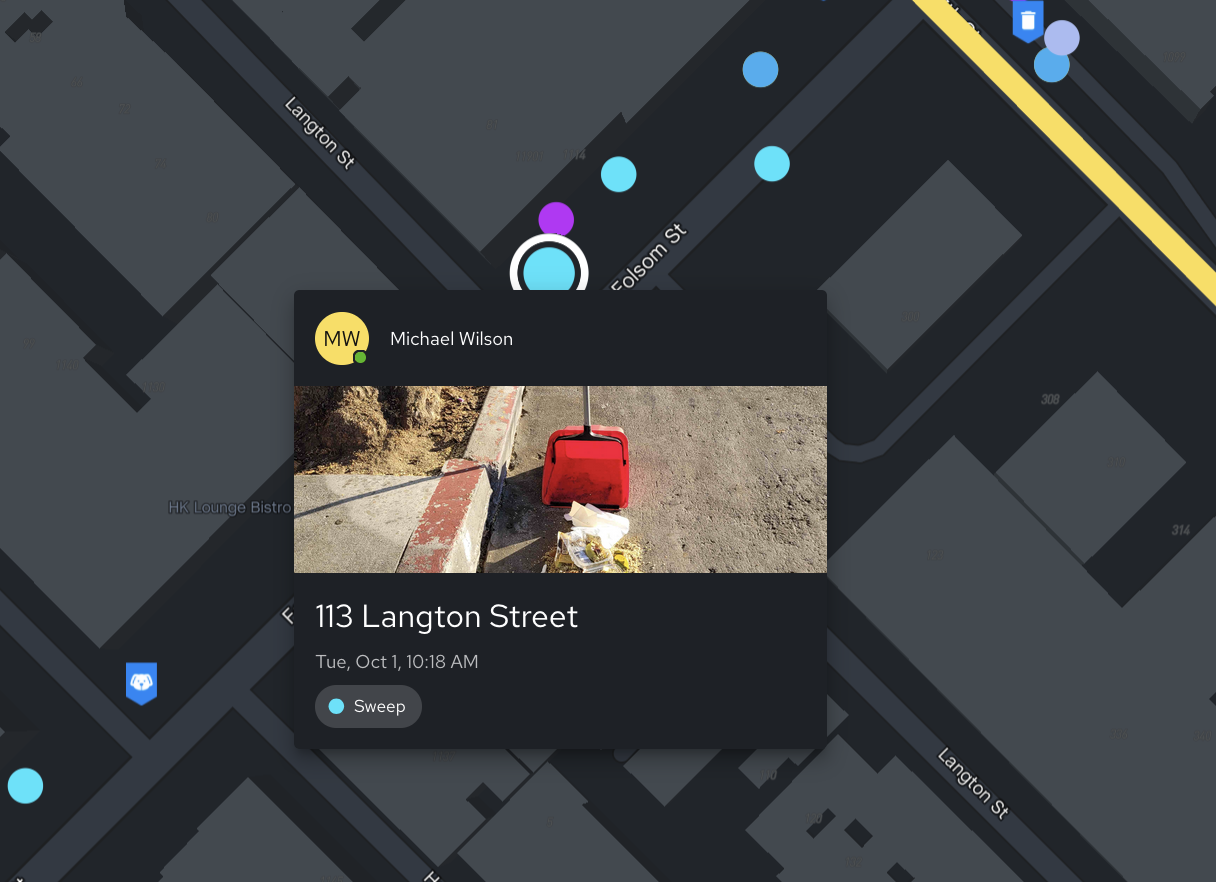
Hovering over a task on the live map will reveal a task card with key information related to that task such as:
Assigned User
Task Category
Image
Address
Time Created (or Completed)
Toggle Live Map Layers
Click the “Map Layers” icon in the bottom left of the Home page.
In the “Map Layers” menu, you can toggle the following:
Tasks
Users
Fixed Assets
Route History
Filter Live Map Data
To filter task data on the Live Map, click the “Filter” icon  located in the upper-right of the page. This will open the Filters menu.
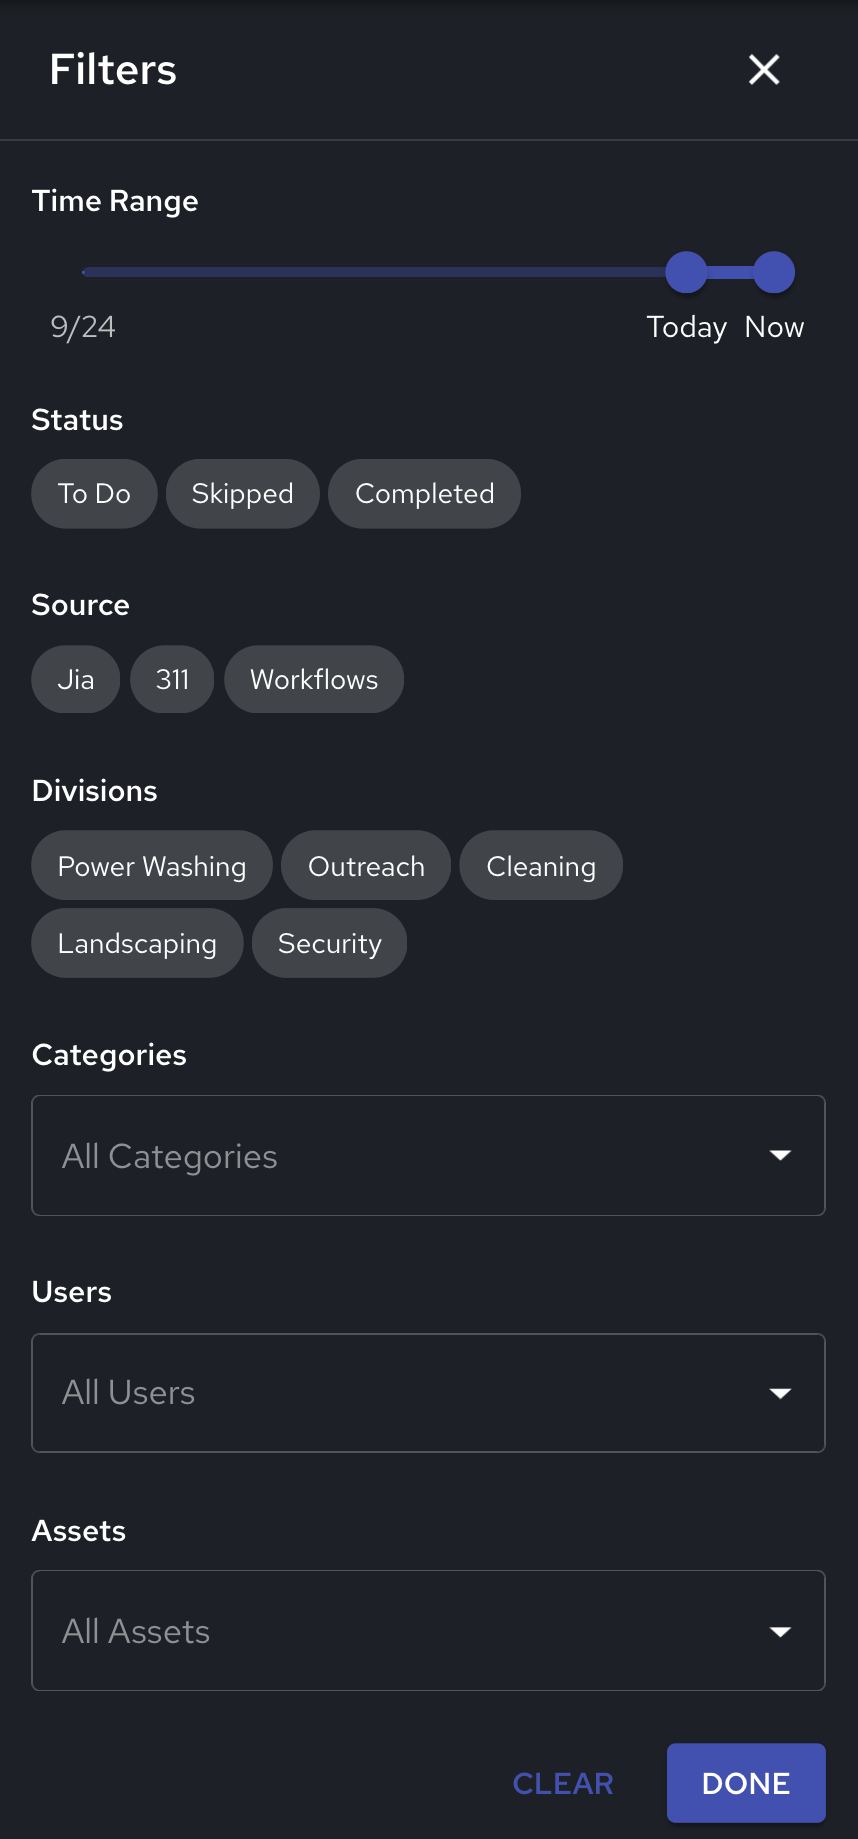
Here, you can filter data on the Live Map by the following filters:
Date - You can view up to 1 week’s worth of data on the Live Map
Status
Task Source
Division - Filter for all tasks from this division
Task Category - You can select for multiple categories at once
Assigned User - You can select for multiple users at once. Filtering for a user will also turn on Route History
Assets - You can select for multiple fixed assets at once
Users Panel
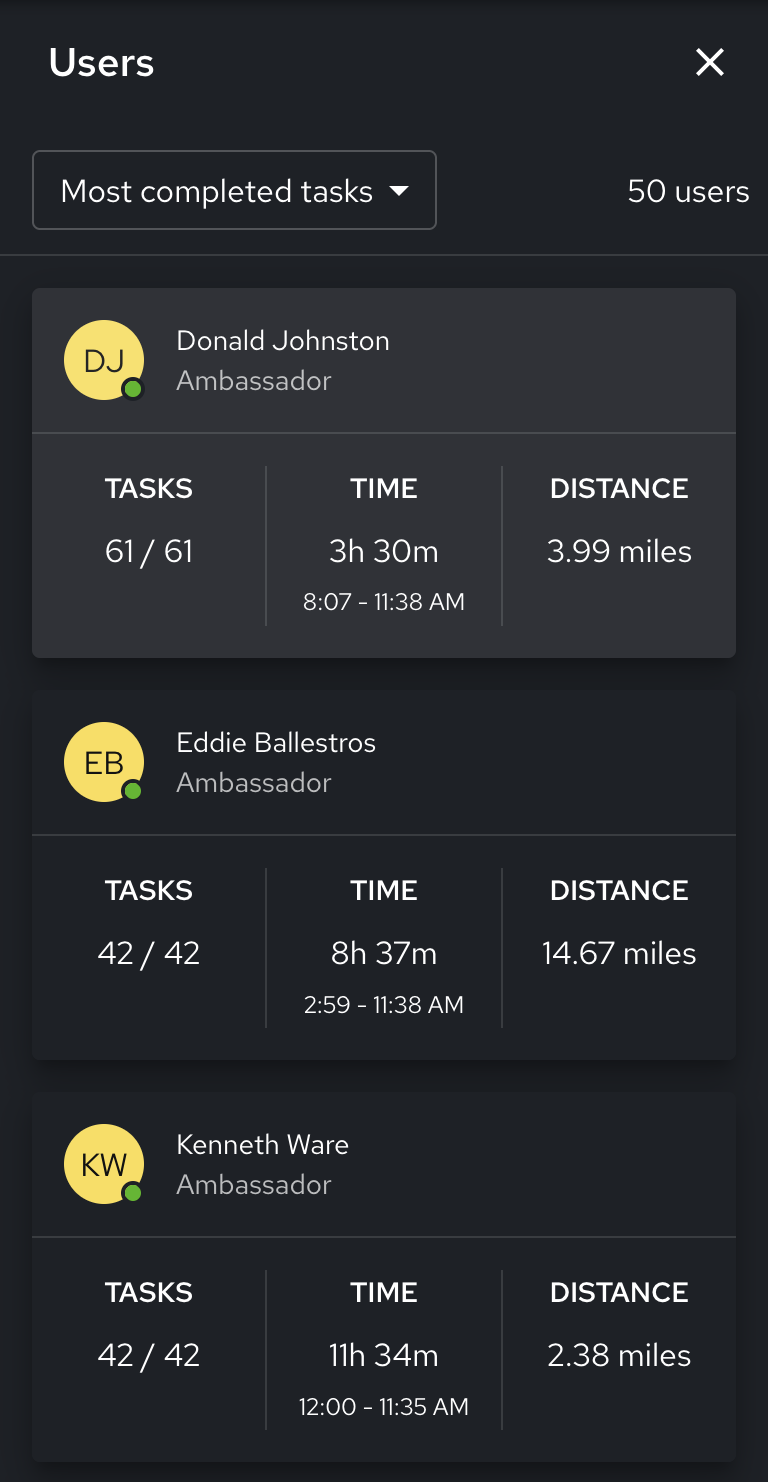
Click the “Users” icon in the right-rail sidebar to open the Users Panel. Here, you can see the members of your team organized in a list. By default, this list is sorted by the number of tasks completed. This list reflects the current set of applied filters. For each member of the team, you can see:
How many tasks they’ve completed across the applied set of filters.
How long they’ve been on shift.
The Distance they’ve traveled across their current shift.

You can click any user in this list to filter Live Map data and turn on Route History for that user. If the user is online, the map will also zoom into their location.
Insights Panel
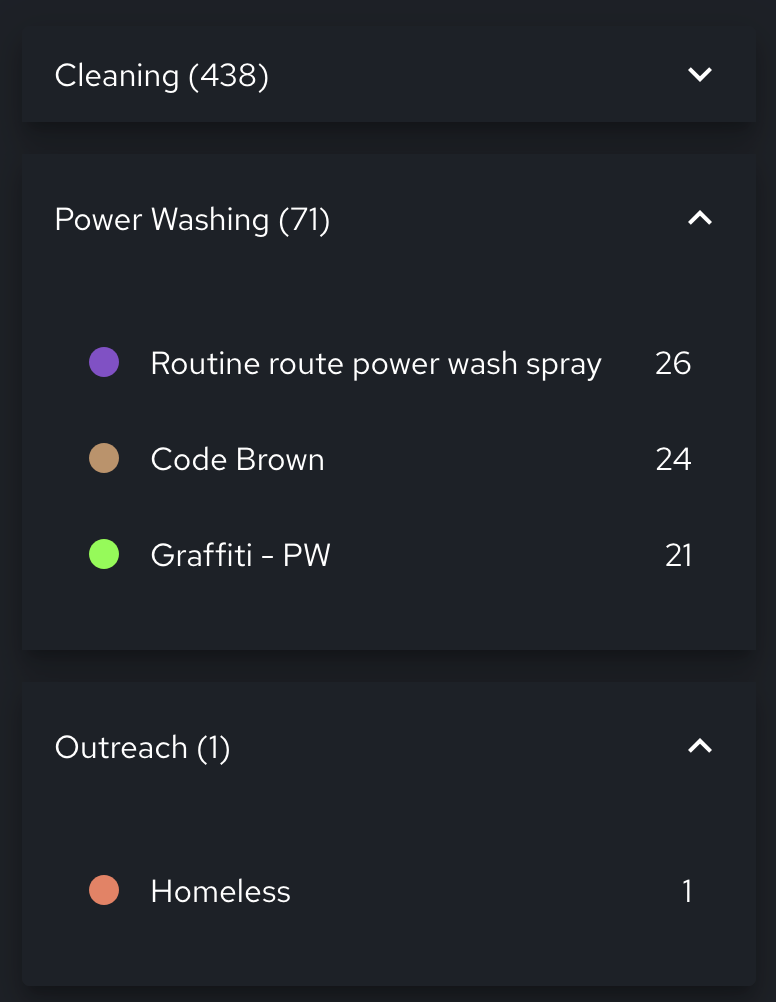
Click the “Insights” icon in the right-rail sidebar to open the Insights Panel.
Here, you can see the total number of tasks that have been completed, organized by Division and Category
The Insights Panel will update to reflect the filters applied from the Filters menu. Try changing a date range or filtering for user and see what happens!
Assets Panel
Click the “Assets” icon in the right-rails sidebar to open the Assets Panel.
Here, you can see the total number of tasks that have been completed at each fixed asset.
You can click each fixed asset to filter data on the live map to that fixed asset.

Looking to add fixed assets to your map? Please reach out to support@getjia.co to get started!